Question
A random survey of the number of children of various age groups playing in a park was found as follows:
|
Age (in years) |
Number of children |
|
1–2 |
5 |
|
2–3 |
3 |
|
3–5 |
6 |
|
5–7 |
12 |
|
7–10 |
9 |
|
10–15 |
10 |
|
15–17 |
4 |
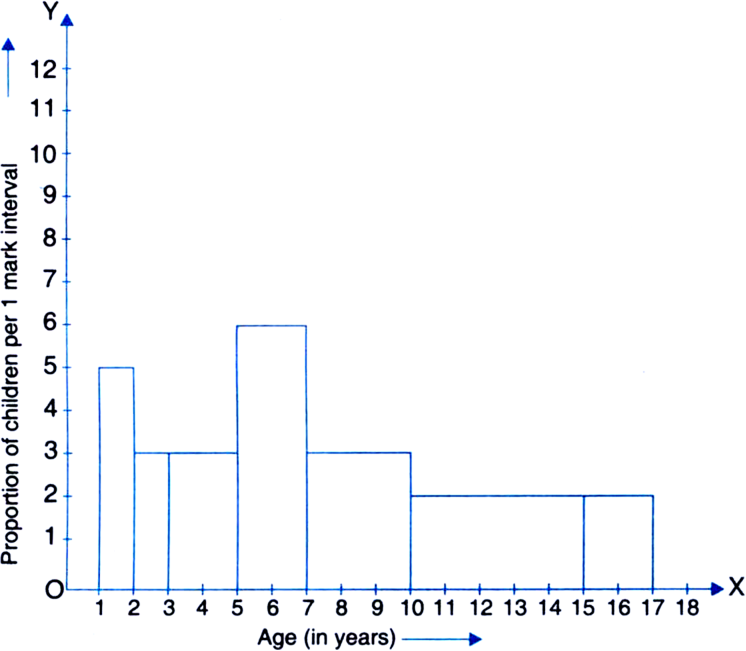
Draw a histogram to represent the data above.
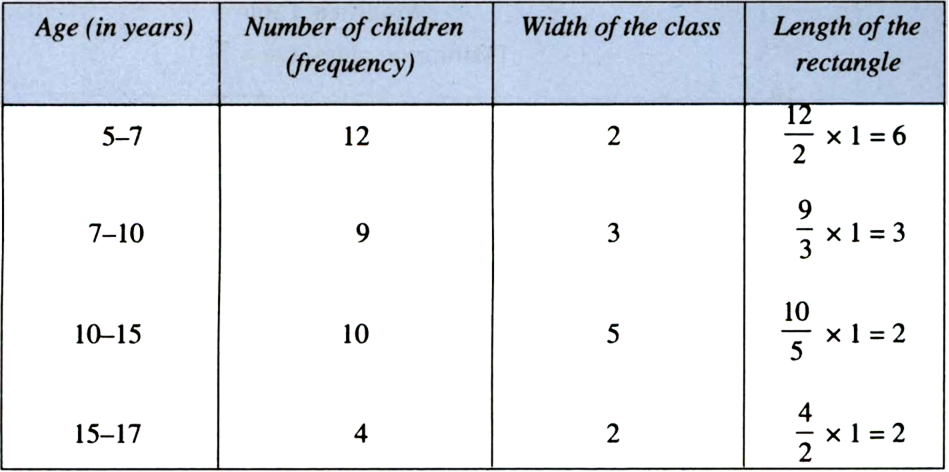
Solution
Modified Table