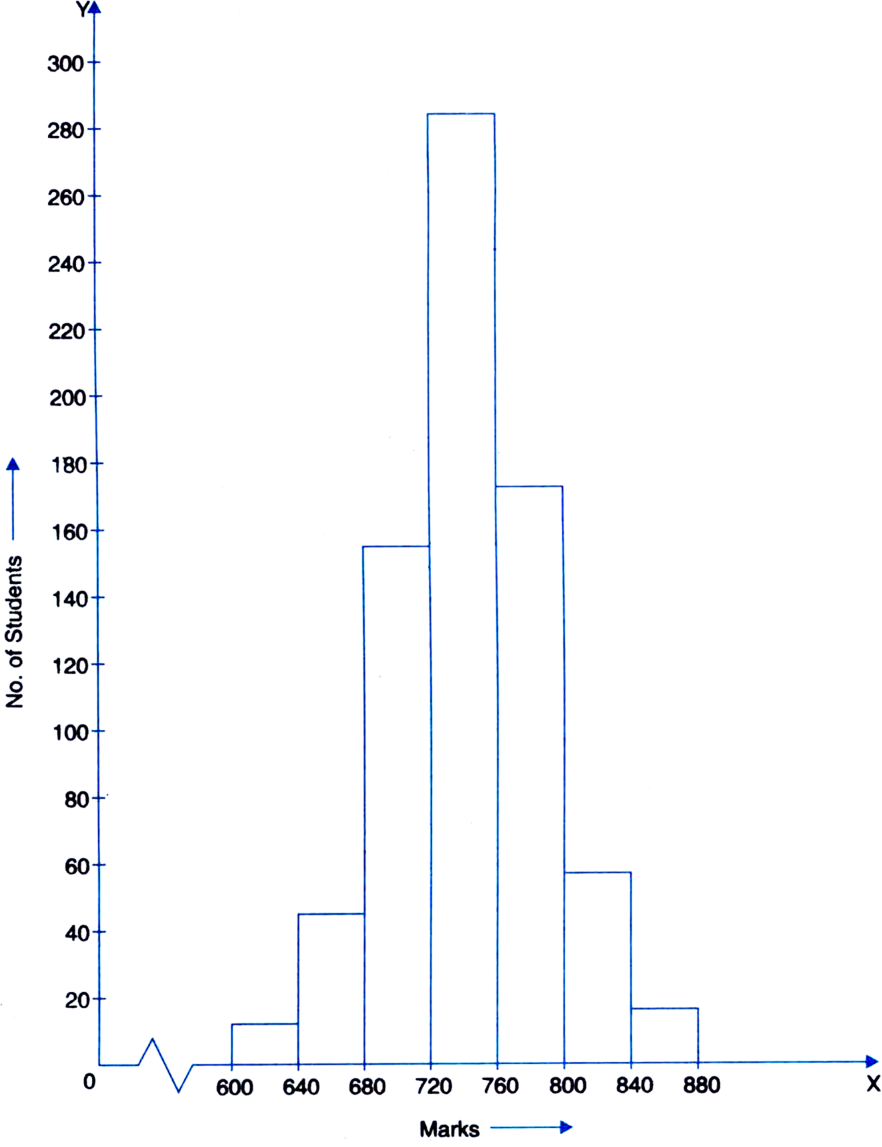
The marks scored by 750 students in examination are given in the form of a frequency distribution table.
|
Marks |
No. of students |
|
600–640 |
16 |
|
640–680 |
45 |
|
680–720 |
156 |
|
720–760 |
284 |
|
760800 |
172 |
|
800–840 |
59 |
|
840–880 |
18 |
Draw a histogram to represent the above data.


