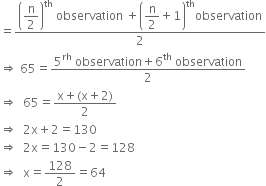
-->

Proofs In Mathematics

Question
CBSEENMA9004118

The following observations have been arranged in ascending order. If the median of the data in 65, find the value of x.
32, 35, 50, 51, x, x + 2, 73, 76, 83, 90

Solution
Number of observation (n) = 10, which is even.

therefore   Median
equals fraction numerator open parentheses begin display style straight n over 2 end style close parentheses to the power of th space observation space plus open parentheses begin display style straight n over 2 end style plus 1 close parentheses to the power of th observation over denominator 2 end fraction
rightwards double arrow space 65 equals fraction numerator 5 to the power of rh space observation plus 6 to the power of th space observation over denominator 2 end fraction
rightwards double arrow space space 65 equals fraction numerator straight x plus left parenthesis straight x plus 2 right parenthesis over denominator 2 end fraction
rightwards double arrow space space 2 straight x plus 2 equals 130
rightwards double arrow space space 2 straight x equals 130 minus 2 equals 128
rightwards double arrow space space straight x equals 128 over 2 equals 64

Some More Questions From Proofs in Mathematics Chapter

The value of π 50 decimal places is given below:

3.14159265358979323846264338327950288419716939937510

(i) Make a frequency distribution of the digits from 0 to 9 after the decimal point.
(ii) What are the most and the least frequently occurring digits?

Thirty children were asked about the number of hours they watched TV programmes in the previous week. The results were found as follows:

1 6 2 3 5 1 2 5 8 4 8

10 3 4 12 2 8 15 1 17 6

3 2 8 5 9 6 8 7 14 12

(i) Make a grouped frequency distribution table for this data, taking class width 5 and one of the class intervals as 5–0.
(ii) How many children watched television for 15 or more hours a week?

A company manufactures car batteries of a particular type. The lives (in years) of 40 such batteries were recorded as follows:

2.6 3.0 3.7 3.2 2.2 4.1 3.5 4.5

3.5 2.3 3.2 3.4 3.8 3.2 4.6 3.7

2.5 4.4 3.4 3.3 2.9 3.0 4.3 2.8

3.5 3.2 3.9 3.2 3.2 3.1 3.7 3.4

4.6 3.8 3.2 2.6 3.5 4.2 2.9 3.6

Construct a grouped frequency distribution table for this data, using class intervals of size 0.5 starting from the interval 2–2.5.

The relative humidity (in %) of a certain city of month of 30 days was as follows:

98 98 99 90 86
95 92 96 94 95
89 92 97 93 92
95 97 93 95 97
96 92 84 90 95
98 97 96 92 89
Construct a grouped frequency distribution table with classes 84–88, 88–92, etc.

The number of books in different shelves of a library are as follows: 25, 27, 32, 24, 28,

34, 20, 25, 28, 30,
20, 35, 25, 27, 31,
37, 22, 24, 27, 28,
27, 20, 36, 21, 20,
29, 30, 29, 36, 30
Prepare a frequency distribution table with class size 4 for the data given above taking the first interval as 18–22. (22 not included).

The blood group of 20 students are recorded as follows:
A, B, O, O, AB, O, A, O, B, A, O, AB, O, A, A, O. B, A, B, O
Represent this data in the form of a frequency distribution table. Which is the rarest blood group?

The distance in km of 32 engineers from their residence to their place of work were found as follows:

4, 6, 10,12, 8, 13, 12, 9, 11, 16, 10, 18, 15, 3, 8, 4,
10, 8, 7, 9, 5, 15, 18, 3, 11, 15, 2, 10, 14, 7, 6, 12

Construct a grouped frequency distribution table with class-size for the data given above taking the first interval as 0–5. 

A part of the frequency table is given below:

Class marks of weights (in kg)

No. of students

33

9

38

5

43

14

Rewrite the table with class limits.

The marks obtained out of 75 by 30 students of a class in an examination are given below:

42, 21, 50, 37,42, 37, 38, 42, 49, 52, 38, 53, 57, 47, 29, 59, 61, 33, 17, 17, 39, 44, 42, 39, 14, 7, 27, 19, 54, 51
Prepare a frequency distribution table in which the size of class intervals is the same and one class interval is 0–10.