

Sponsor Area
Determination Of Income And Employment
Question
Explain consumption function with the help of a schedule and diagram.
Solution
A consumption function schedule and diagram given below further clarify the concept of consumption function.
|
National Income (Y) र crores |
Consumption (C) र crores |
|
0 |
60 |
|
100 |
140 |
|
200 |
220 |
|
300 |
300 |
|
400 |
380 |
|
500 |
460 |
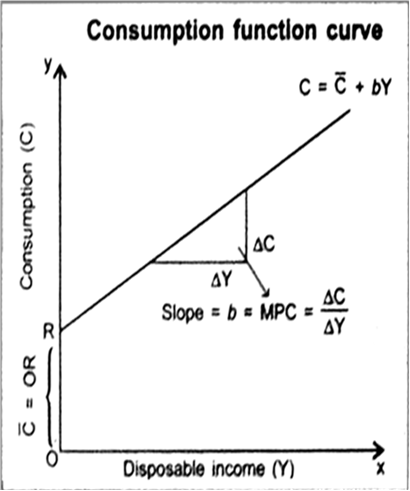
Fig.(a)
Comment. A consumption function curve indicating
 is drawn in Fig.(a)
(i) The consumption curve starts from a positive point R which indicates that even when income is zero, consumption expenditure equal to OR is incurred from past savings. Thus OR represents autonomous consumption

(ii) Consumption curve slopes upwards which shows direct relationship, i.e., when income increases, consumption expenditure also increases but in a lesser proportion,
(iii) The rising slope of consumption curve is b (i,e„ MPC = ΔC/ΔY),
(iv) Since slope of curve is constant, we get a straight line consumption curve.


Some More Questions From Determination of Income and Employment Chapter
What are the types of Propensity to consume?
How does MPC affect level of income?
Distinguish between APC and MPC, The value of which of APC and MPC can be greater than one and when?
State relationship between income and saving.
What is saving function (or Propensity to save)?
Sponsor Area
Mock Test Series
Mock Test Series