Explain saving function with the help of a schedule and diagram.
|
Income (Y) |
Consumption C) |
Saving (S = Y – C) |
|
0 |
30 |
-30 |
|
100 |
100 |
0 |
|
200 |
170 |
30 |
|
300 |
240 |
60 |
|
400 |
310 |
90 |
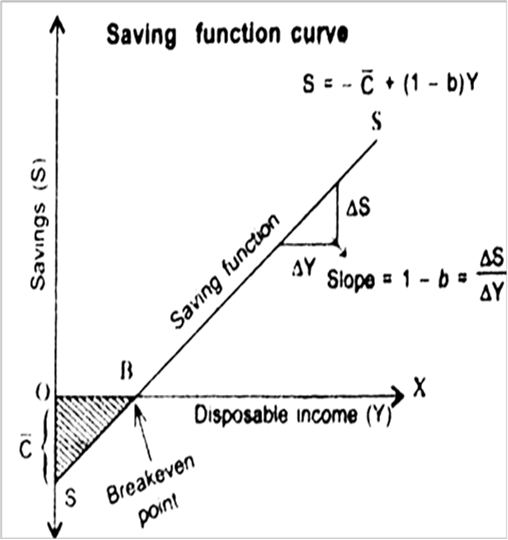
A diagrammatic representation of relationship between income and savings level gives the saving function curve. In the figure given below, saving function curve SS is a straight line because slope of saving is constant. The curve slopes upward which depicts direct relationship between income and saving. The saving function line SS cuts the income line at point B which is called Break-even point because at this point consumption expenditure is equal to income (or savings are zero). To the left of breakeven point savings are negative indicating consumption being more than income whereas to the right of breakeven point, savings are positive indicating consumption expenditure being less than income. The shaded area reflects dissavings which is equal to the area of autonomous consumption shown as  in the fig given below.