Take an imaginary example applicable to geographical analysis and explain direct and indirect methods of calculating mean from ungrouped data.
Direct method : The following table gives rainfall figures of a place calculation in mean by direct method:
|
Rainfall (in mm) |
30-35 |
35-40 |
40-45 |
45-50 |
50-55 |
55-60 |
60-65 |
65-70 |
70-75 |
|
No. of days |
5 |
6 |
11 |
18 |
19 |
15 |
13 |
1 |
2 |
(i) Direct Method
|
Class (Rainfall) (in mm) |
No. of days (Frequency) (f) |
Mid-Point m |
fm |
Class (Rainfall) (in mm) |
No. of days (Frequency) (f) |
Mid-point m |
fm |
|
30-35 |
5 |
32.5 |
162.5 |
55-60 |
15 |
57.5 |
862.5 |
|
35-40 |
6 |
37.5 |
225.0 |
60-65 |
13 |
62.5 |
812.5 |
|
40-45 |
11 |
42.5 |
467.5 |
65-70 |
1 |
67.5 |
67.5 |
|
45-50 |
18 |
47.5 |
855.0 |
70-75 |
2 |
72.5 |
145.0 |
|
50-55 |
19 |
52.5 |
997.5 |
||||
|
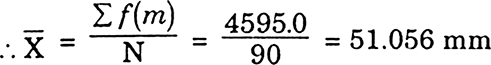
n=Σf=90 |
Σfm = 4595.0 |
||||||
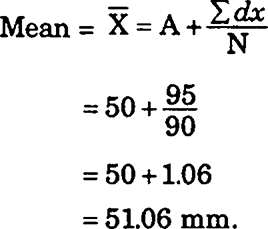
(ii) Indirect Method : The folllowing formula is used in computing the measuring indirect method :
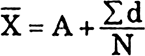
Where :
A = Subtracted constant, d = Sum of the coded scores.
N = Number of individual observation in a series.
Example : Assumed Mean = 50
|
Rainfall |
Mid-values |
dx = X–A |
No. of days |
fdx |
||
|
30–35 |
32.5 |
32.5–50 |
= |
–17.5 |
5 |
5×–15.5 = –87.5 |
|
35–40 |
37.5 |
37.5–50 |
= |
–12.5 |
6 |
6×–12.5 = –75 |
|
40–45 |
42.5 |
42.5–50 |
= |
–7.5 |
11 |
11×–7.5 = –82.5 |
|
45–50 |
47.5 |
47.5–50 |
= |
–2.5 |
18 |
18×–2.5 = –45.0 |
|
50–55 |
52.5 |
52.5–50 |
= |
+2.5 |
19 |
19×+2.5 = 47.5 |
|
55–60 |
57.5 |
57.5–50 |
= |
+7.5 |
15 |
15×+7.5 = 112.5 |
|
60–65 |
62.5 |
62.5–50 |
= |
+12.5 |
13 |
13×+12.5 = 162.5 |
|
65–70 |
67.5 |
67.5–50 |
= |
+17.5 |
1 |
l×+17.5 = 17.5 |
|
70–75 |
72.5 |
72.5–50 |
= |
22.5 |
2 |
2×+22.5 = 45.0 |
|
N = 90 |
Σfdx = 95 |