Question
The curve given below shows enzymatic activity with relation to three conditions (pH, temperature and substrate concentration)
What do the two axises (X and Y) represent?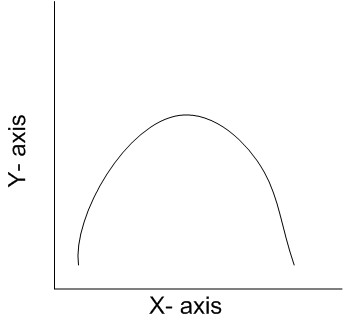
-
X –axis
Y-axis
Temperature
Enzyme activity
-
X –axis
Y-axis
Substrate concentration
enzymatic activity
-
X –axis
Y-axis
enzymatic activity
temperature -
X –axis
Y-axis
enzymatic activity
pH
Solution
A.
|
X –axis |
Y-axis |
|
Temperature |
Enzyme activity |
X -axis represents temperature and Y-axis represent enzyme activity. All enzyme act at an optimum temperature, above and below this temperature, the enzyme acitivity declines.


