

CBSE physics
Sponsor Area
Draw a graph to show variation of capacitive-reactance with frequency in an a.c. circuit.
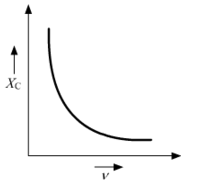
Here, XC is the capacitive-reactance and is the frequency in an a.c circuit.


Sponsor Area
The field lines of a negative point charge are as shown in the figure. Does the kinetic energy of a small negative charge increase or decrease in going from B to A? 
The electric field present due to the given point charge will be directed towards the centre. A negative charge always experiences a force in the direction opposite to that of the external electric field present; that is away from the centre. This will cause its motion to retard while moving from B to A. Hence, its kinetic energy will decrease in going from B to A.
Distinguish between emf and terminal voltage of a cell.
|
Emf |
Terminal Voltage |
|
The maximum potential difference that can be delivered by a cell when no current flows through the circuit. |
Potential difference across the terminals of the load when the circuit is switched on and current flows through it. |
|
It is represented by E and remains constant for a cell. |
It is represented by V and depends on the internal resistance. |
In a meter bridge shown in the figure, the balance point is found to be 40 cm from end A. If a resistance of 10 is connected in series with R, balance point is obtained 60 cm from A. Calculate the values of R and S. 
For null point, balance length l1 = 40 cm
So,  ... (1)
If resistance 10  is connected in series of R, balance point shifts towards AD = 60 cm.
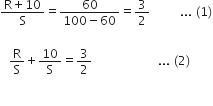
From equations (1) and (2), we have
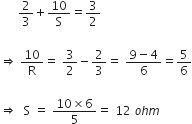
From equation (1), we have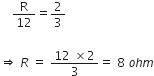
A series LCR circuit is connected across an a.c. source of variable angular frequency ‘ ’. Plot a graph showing variation of current 'i' as a function of ‘’ for two resistances R1 and R2 (R1 > R2).
Answer the following questions using this graph:
(a) In which case is the resonance sharper and why?
(b) In which case in the power dissipation more and why?
a) The variation of current with angular frequency for the two resistances R1 and R2 is shown in the graph below:
We can see that the resonance for the resistance R2 is sharper than for R1 because resistance R2 is less than resistance R1. Therefore, at resonance, the value of peak current will rise more abruptly for a lower value of resistance.
b) Power associated with resistance is given by, 
From the above graph, we can say that virtual current in case of R2 is more than the virtual current in case of R1. Therefore, the power dissipation for circuit with R2 is more than that with R1.
Sponsor Area
Mock Test Series
Mock Test Series