Question
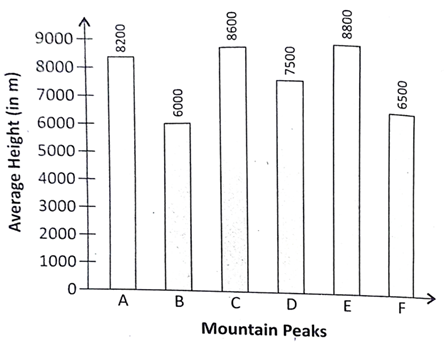
A bar graph showing the heights of six mountain peaks. Study the bar graph and answer the questions.

Write the ratio of the heights of the highest peak and the lowest peak.
-
22 : 15
-
15 : 22
-
20 : 13
-
13 : 22
Solution
A.
22 : 15
Ratio of the heights of the highest peak and lowest peak
= 8800 : 6000 = 22 : 15