Data Handling

Sponsor Area

Question
CBSEENMA8003207

Following are the marks scored by 30 students in a test out of 40 marks. Using tally marks prepare a frequency table:

30

18

27

15

25

28

15

30

35

36

25

30

20

28

17

30

36

35

35

18

30

17

30


25

36

28

25

25

18

16

Solution

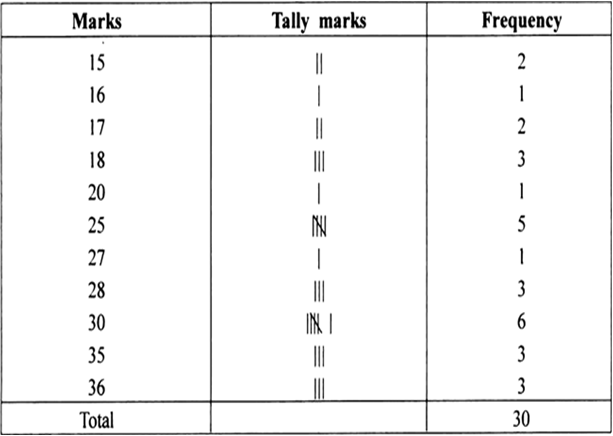
Using tally marks, the required frequency is as given below:
Sponsor Area

Question
CBSEENMA8003208

Present the following data in the form of a grouped frequency distribution table having 6 classes of equal size (one of the class being 40–48):

30

39

58

17

34

50

23

37

42

49

55

59

19

28

47

49

18

60

56

36

58

35

55

37

25

34

39

61

53

33

36

53

61

62

39

53

21

18

28

23

Solution

The highest observation = 61.
The lowest observation = 17.
One of the class intervals = 40–48.
Class size = Upper class limit - Lower class limit = 48 – 40 = 8
∴ The appropriate classes can be:
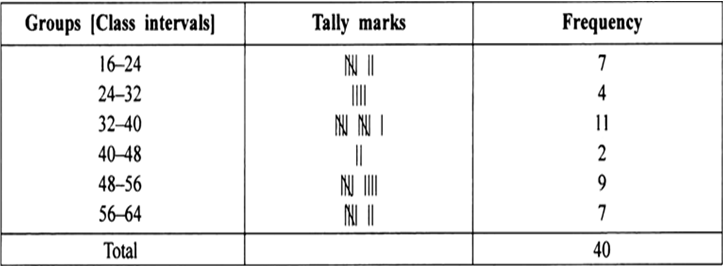
16–24, 24–32, 32–40, 40–48, 48–56, 56–64
Thus, the frequency distribution table for the above data can be:

Question
CBSEENMA8003209

Draw an appropriate graph to represent the given information.


Solution


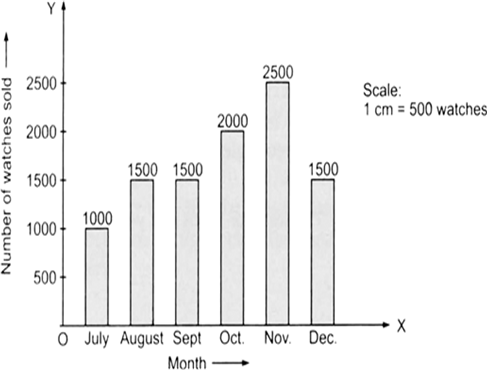
To represent the given data by a bar-graph, draw two axes perpendicular to each other. Now, represent ‘Months’ on OX and ‘Number of watch sold’ on OY. Erect rectangles of the same width. The heights of the rectangles are proportional to number of watches, using a suitable scale:

Here, scale is 1 cm = 500 watches
Since 500 watches = 1 cm
1000 watches = 2 cm
1500 watches = 3 cm
2000 watches = 4 cm
2500 watches = 5 cm

Question
CBSEENMA8003210

Draw an appropriate graph to represent the given information.


Solution


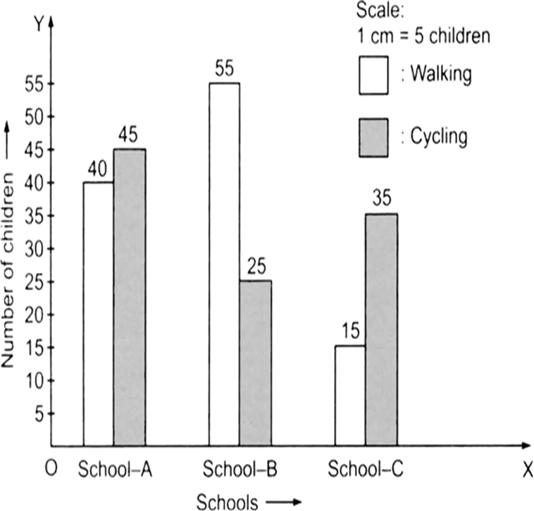
Since, a comparison of two activities (walking and cycling) is to be represented, therefore a double-graph is drawn by taking the schools along x-axis and number of children along y-axis, using a scale of 1 cm = 5 children.