Sponsor Area
X-Rays
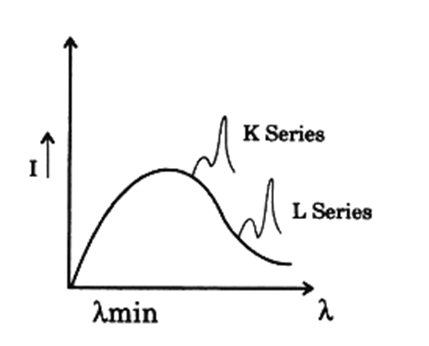
(i) Draw a labelled graph showing variation of relative intensity of X-rays versus their wavelength λ . Mark on the graph.
(ii) State how the value of can be varied.
i) The below graph shows the variation of intensity of X-rays VS. theri wavelength  .
.
ii)  min is inversely proportioned to voltage applied to X ray tube.
An X ray tube is operated at a tube potential of 40,000 V. Calculate :
(i) Kinetic energy of an electron emitted by the filament when it reaches the target / anode.
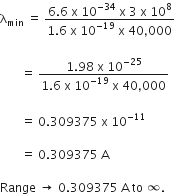
(ii) Wavelengths of all the X rays emitted by the X ray tube.
(i) Given V = 40,000V.
We know KE = eV
= 1.6 x 10-19x 40,000
= 6.4 x lO-15 J.
ii) We know,
Which electromagnetic wave is longer than X-ray but shorter than light wave?
Ultraviolet waves are the electromagnetic wave which are longer than X-ray but shorter than light wave.
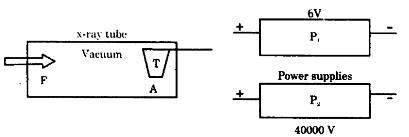
Figure 12 below shows a simple X ray tube. P1 and P2 are power supplies which generate 6 V and 40,000 V respectively. Show how you will connect these power supplies to the X ray tube so that it starts producing X rays.

The 40000 volt (P2)supply is connected across the x-ray tube where as P1 supply of 6 volt is connected across the Filament F. The positive end of the P2 supply is connected to target
T and negative end of P2 is connected to one of the terminal of filament F.
The negative end of the P1 is connected to that terminal of the filament where the P2 is connected and positive end of the P1 is connected to the other terminal of the filament.
Sponsor Area
Mock Test Series
Mock Test Series


