

Sponsor Area
Proofs in Mathematics
Give five examples of data that you can collect from your day-to-day life.
(i) Number of students in our class,
(ii) Number of fans in our school.
(iii) Electricity bills of our house for last two years.
(iv) Election results obtained from television or newspaper.
(v) Literacy rate figures obtained from


Classify the data in Q. 1 above as primary or secondary data.
(i), (ii) and (iii) are primary data. (iv) and (v) are secondary data.
The blood groups of 30 students of Class VIII are recorded as follows:
A,B,O,O,AB,O,A O,B,A,O,B, A,O,O,
A,AB,O,A,A,O,O,AB,B,A,O,B,A,B.O.
Represent this data in the form of a frequency distribution table. Which is the most common and which is the rarest, blood group among these students.
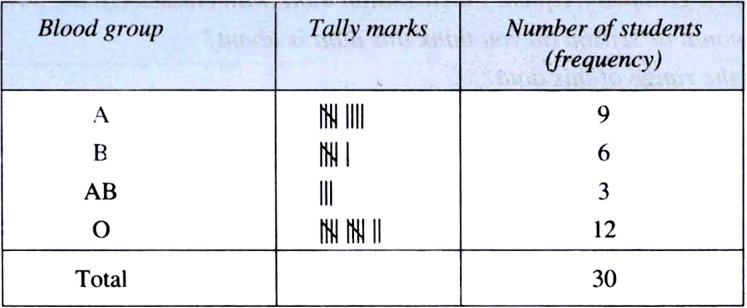
O is the most common and AB is the rarest blood group among these students.
The distance (in km) of 40 engineers from their residence to their place of work were found as follows:
5 3 10 20 25 11 13 7 12 31
19 10 12 17 18 11 32 17 16 2
7 9 7 8 3 5 12 15 18 3
12 14 2 9 6 15 15 7 6 12
Construct a grouped frequency distribution table with class size 5 for the data given above, taking the first interval as 0–5 (5 not included). What main features do you observe from this tabular representation ?
(i)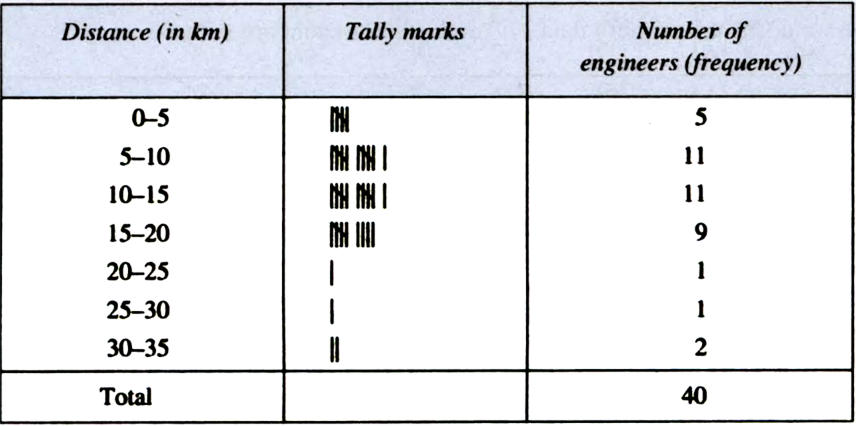
We observe the following main features from this tabular representation:
(i) The distances (in km) from their residence to their work place of the maximum number of engineers are in the third interval, i.e., 10–15.
(ii) The distances (in km) from their residence to their work place of the minimum number of engineers are in the intervals 20–25 and 25–30 each.
(iii) The frequencies of the intervals 20–25 and 25–30 are the same. (Each = 1)
Sponsor Area
Mock Test Series
Mock Test Series